15 May, 2024

Letter To Investors - April

Letter to Investors • 13 mins read

Back to Insights Back to Insights

Welcome to the April Ophir Letter to Investors – thank you for investing alongside us for the long term.

Trust the Process

After five consecutive months of big gains it was bound to end. Global share markets finally fell in April, the first monthly pull back since October last year.

Why?

Unfortunately, the market can’t tell you. Sometimes it happens for no good reason at all. But everyone loves a narrative, so here goes…

Evidence has been building the last few months that inflation in the US isn’t coming down as quickly as the US Federal Reserve or economists in general would have hoped or forecast. This has seen annual core CPI (Consumer Price Inflation) in the US show signs of bottoming out somewhere north of the Fed’s 2% inflation target (red line below).

As a result, US interest rates, both of the short and long-term variety (see yellow line below for key long-term US 10-year government bond rate) moved higher. Back in the third quarter of 2023, when the US 10-year bond rate started moving through 4.5%, share market weakness set in and that is what looks to have occurred in April just gone (black line). The share market can deal with higher interest rates to a point, then they start to impact valuations.

Stickier inflation/High bond yields weigh on U.S. share market in April

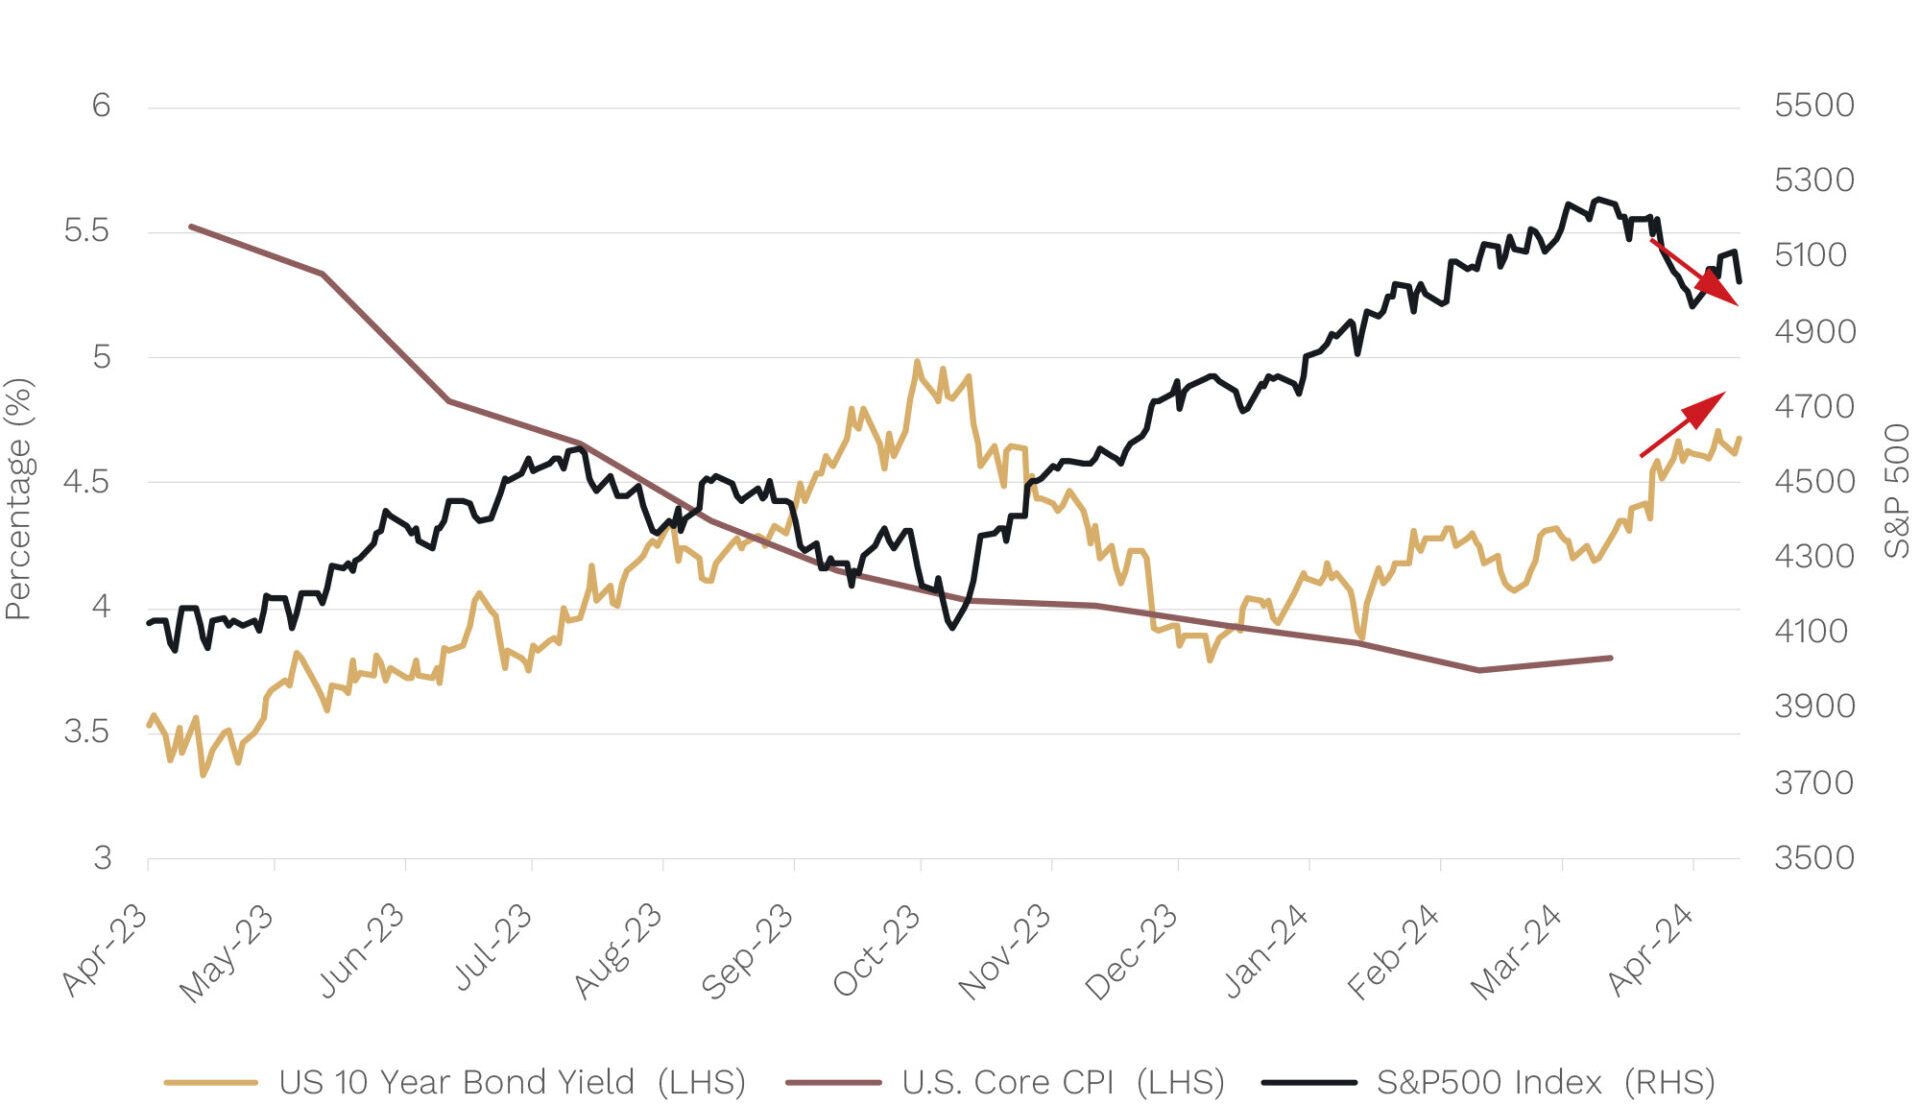
Source: Bloomberg. Data to 30 April 2024

Pull backs in share markets are healthy and are to be expected. If they moved up in a straight line, they would cease to be risky and you wouldn’t get superior long-term returns relative to other asset classes.

For now, this dance is likely to continue. On the one hand, still-reasonable earnings growth globally is seeking to push share markets higher. While on the other, the vicissitudes of inflation data and their flow-on effects to interest rates are providing temporary headwinds (in the case of April) or tailwinds to company valuations and ultimately share markets as a whole.

In this month’s Letter to Investors, though, we’d like to step back and examine a vital principle: the importance of focusing on ‘process’ and not ‘outcomes’.

We look at how this principle applies to the investment process that has successfully guided us as professional investors for around two decades each; but also explore how it applies to individual stock holdings … including the painful example of Australian software company, Altium.

You don’t always get the outcome you want in the short term. The good news, however, is that our long-held investment process is currently bearing fruit for our Global Funds during the current reporting season.

April 2024 Ophir Fund Performance

Before we jump into the letter in more detail, we have included below a summary of the performance of the Ophir Funds during April. Please click on the factsheets if you would like a more detailed summary of the performance of the relevant fund.

The Ophir Opportunities Fund returned -1.2% net of fees in April, outperforming its benchmark which returned -3.1%, and has delivered investors +21.6% p.a. post fees since inception (August 2012).

Download Ophir Opportunities Fund Factsheet

The Ophir High Conviction Fund (ASX:OPH) investment portfolio returned -3.3% net of fees in April, underperforming its benchmark which returned -2.6%, and has delivered investors +12.9% p.a. post fees since inception (August 2015). ASX:OPH provided a total return of -4.8% for the month.

Download Ophir High Conviction Fund Factsheet

The Ophir Global Opportunities returned -2.1% net of fees in April, outperforming its benchmark which returned -4.3%, and has delivered investors +14.1% p.a. post fees since inception (October 2018).

Download Ophir Global Opportunities Fund Factsheet

The risk of ‘resulting’

It’s 2014 at the end of Super Bowl XLIX with 26 seconds left. The Seattle Seahawks were down by four points against the New England Patriots.

The Seahawks were on the Patriot’s one-yard line just outside the end zone and it was only the second down[1]. It was a golden opportunity for the Seahawks to snatch a victory.

Seahawks coach Pete Carroll called a timeout and told his quarterback to pass the ball instead of making a running play.

The quarterback passed. But the Patriots intercepted the ball, and the Seahawks lost a game that they looked like they were about to win.

Coach Carroll was crucified by fans for the passing decision. Many see it as the worst call in Super Bowl history, perhaps all of NFL history!

But was it a bad decision?

Former World Series of Poker Champion and cognitive behaviour expert, Annie Duke, thinks not.

In her book ‘Thinking in Bets: Making Smarter Decisions When You Don’t Have All the Facts’, Duke highlights that, based on 15 years of NFL data, the probability of a short pass interception is below 2%.

The Seahawks were much more likely to score a touchdown, or make an incomplete pass that would have barely used any clock time (and doesn’t count as a down).

If a touchdown results, you’re a genius who won the game doing what the opposition didn’t expect you to do. While an unsuccessful running play loses precious time off the clock and only allows time for one more play.

Just because the low probability event happened (an interception), it doesn’t make it a bad decision by the coach.

Duke sums it up nicely:

“What makes a decision great is not that it has a great outcome. A great decision is the result of a good process, and that process must include an attempt to accurately represent our own state of knowledge.”

The takeaway: in games where there is chance, and the probabilities aren’t certain (i.e. 100%), you can’t judge a decision by a result.

So-called ‘resulting’ is what poker players call the tendency to judge a decision based on its outcome rather than its quality. Investors need to avoid ‘resulting’ at all costs.

Two decades of trusting our process

At Ophir, we are highly focused on the ‘process’ principle at the portfolio level.

As long-time readers will know, we (Andrew and Steven) started out as Australian small-cap investors around 15-20 years ago. Then, as our most successful ‘Aussie’ investments increasingly became global as they expanded overseas, we launched into global small caps some six years ago.

Through that time, the ideal company in which we invest has not changed. It is typically AUD$500 million to $10 billion in market cap, growing revenue and profits above the market (so generally 10%+ per annum), taking market share, and growing into a big end market wherever that is in the world.

We strongly believe, and the evidence backs it up, that earnings drive company share prices in the long term. You can see this in the chart below where revenue growth, changes in margins and free cash flow all add up to earnings growth, which dominates as the driver of share market returns over time. And providing you don’t overpay for that above-average earnings growth, you give yourself a great chance of generating attractive investment returns and beating the market averages.

Key drivers stock performance – S&P 500 (1990-2009)

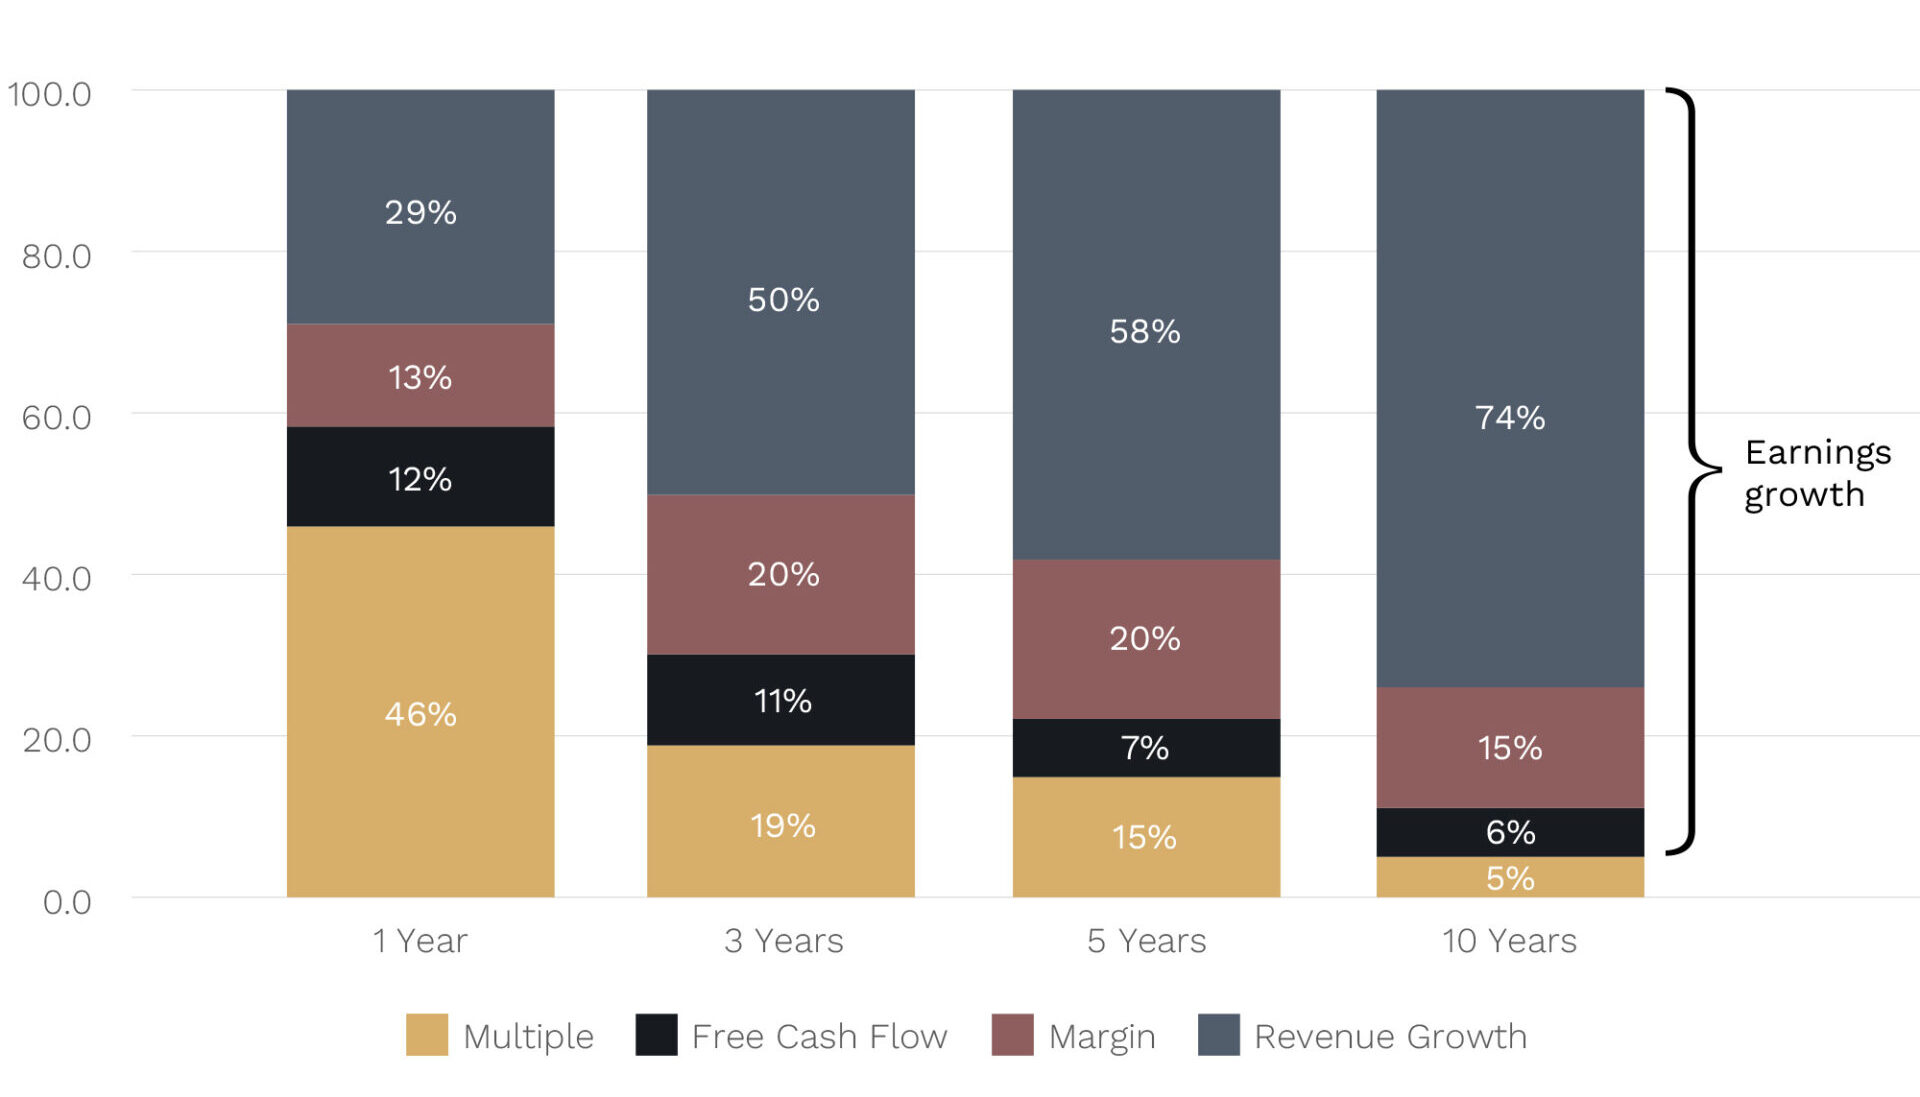
Source: Morgan Stanley Research

We also believe that one of the best indicators of above-average earnings growth over the longer term is strong earnings growth today that is beating market expectations.

If you were a fly on the wall in our investment team meetings, you would hear us focussed on how confident we are that our portfolio companies are likely to beat the market’s expectations for revenue and profit growth at their next result.

This, however, doesn’t guarantee you good investment returns in your portfolio in the short term. Changes in valuations multiples (yellow bar above), both at a stock and portfolio level, can swamp the fundamentals of revenue and earnings growth.

This was particularly the case in late 2021 to mid-2022 in our funds, and in particular our Global Funds, where despite still overwhelmingly getting the earnings right, valuation multiples decreased to a degree not seen since the GFC for the entire cohort of small-cap growth-orientated businesses globally, which is of course the pond that we fish in.

(As we discuss below, that’s beginning to change.)

Why we’re happy with this process … despite

But at Ophir, we are also focussed on the ‘process’ principle for individual holdings, as the example of Altium shows.

Altium (ALU) is an Australian stock we held last year in the Ophir High Conviction Fund (ASX:OPH). It makes the most widely used software for the design and manufacturing of printed circuit boards.

But towards the end of 2023, one of our analysts warned us there was going to be an earnings hole at the first half 2024 result due in February 2024.

If we are highly confident an earnings miss is looming at an upcoming result, we will either down-weight the position or sell to zero. In this case the instruction was clear: get out entirely!

Just weeks later, in mid-February, Japanese chipmaker Renesas Electronics lobbed a takeover bid for Altium at $68.50 – a circa 34% premium to the closing price of the company’s shares the day before, valuing the business at A$9.1bn in an all-cash deal.

Our analyst was livid and there was definitely a few swear words in the office! We had lost the chance at significant outperformance by selling the stock early.

Were we (Andrew and Steven) upset at the lost performance opportunity? No!

The reason is simple: The analyst did all the correct work, as part of our process and made the right call with the information they had at the time.

We will never hold onto a company because a takeover offer might be lobbed – the probability is usually just far too small and uncertain.

Low and behold, in late February when Altium came out with its result, it reported a big miss to earnings, that, but for the takeover offer, would normally have seen the stock fall upwards of -30%.

Altium (ALU) share price and earnings

Source: Bloomberg

Our analyst made the right call based on the percentages – a recommendation to sell Altium based on a likely upcoming earnings miss – and this isn’t invalidated due to a small-probability left-field takeover offer effectively rendering the earnings miss meaningless.

The rewards are finally coming

Investing is a long-term game, and you may not be rewarded on every stock at every earnings result. But if you work hard and follow the process on the inputs, the outcomes will look after themselves. Using outcomes on every decision to judge the quality of that decision is a recipe for disaster.

While our Funds’ underperformed in late 2021 to mid-2022, it wasn’t due to us suddenly getting the earnings wrong. We just weren’t being rewarded (getting the outcome) for following our process which helps us to get the earnings more right than not.

The good news is that, more recently, that reward is coming. This reporting season, in particular, for our Global Funds, companies posting earnings beats are seeing their share prices rise and hold on to those gains. As an example, 4 of the top 5 contributing stocks to our Global Funds performance during April was due to earnings results above market expectations where positive share price gains were made as a result and held on to during the month, despite the benchmark falling meaningfully.

Perhaps this is because we don’t have the big headwind of higher interest rates so forcefully anymore, which hurt valuations of small-cap growth-orientated stocks so much.

Perhaps it’s because investors are seeing the attractiveness of valuations outside of the ‘Magnificent 7’, including in small caps.

Perhaps it’s because with slowing economic growth, investors are willing to pay up for growth where it can be found cheaply.

Or maybe, just more simply, it’s a return to what normally happens: companies that are growing faster than the market expects get rewarded.

[1] For non-NFL fans, in American Football you get four attempts to move the ball at least 10 yards up the field. The first of these tries is “first down”, the next “second down” and so on. Once they make it 10 yards or further the downs reset and it’s back to first down.

As always, thank you for entrusting your capital with us.

Kindest regards,

Andrew Mitchell & Steven Ng

Co-Founders & Senior Portfolio Managers

Ophir Asset Management

This document is issued by Ophir Asset Management Pty Ltd (ABN 88 156 146 717, AFSL 420 082) (Ophir) in relation to the Ophir Opportunities Fund, the Ophir High Conviction Fund and the Ophir Global Opportunities Fund (the Funds). Ophir is the trustee and investment manager for the Ophir Opportunities Fund. The Trust Company (RE Services) Limited ABN 45 003 278 831 AFSL 235150 (Perpetual) is the responsible entity of, and Ophir is the investment manager for, the Ophir Global Opportunities Fund and the Ophir High Conviction Fund. Ophir is authorised to provide financial services to wholesale clients only (as defined under s761G or s761GA of the Corporations Act 2001 (Cth)). This information is intended only for wholesale clients and must not be forwarded or otherwise made available to anyone who is not a wholesale client. Only investors who are wholesale clients may invest in the Ophir Opportunities Fund. The information provided in this document is general information only and does not constitute investment or other advice. The information is not intended to provide financial product advice to any person. No aspect of this information takes into account the objectives, financial situation or needs of any person. Before making an investment decision, you should read the offer document and (if appropriate) seek professional advice to determine whether the investment is suitable for you. The content of this document does not constitute an offer or solicitation to subscribe for units in the Funds. Ophir makes no representations or warranties, express or implied, as to the accuracy or completeness of the information it provides, or that it should be relied upon and to the maximum extent permitted by law, neither Ophir nor its directors, employees or agents accept any liability for any inaccurate, incomplete or omitted information of any kind or any losses caused by using this information. This information is current as at the date specified and is subject to change. An investment may achieve a lower than expected return and investors risk losing some or all of their principal investment.  Ophir does not guarantee repayment of capital or any particular rate of return from the Funds. Past performance is no indication of future performance. Any investment decision in connection with the Funds should only be made based on the information contained in the relevant Information Memorandum or Product Disclosure Statement.

Previous

17 Apr, 2024 Letter To Investors - March

Next

17 Jun, 2024 LIC/LIT big discounts – Permanent purgatory or rate cut relief ahead?
17 Apr, 2024

Letter To Investors - March

Letter to Investors • 13 mins read

Back to Insights Back to Insights

Welcome to the March Ophir Letter to Investors – thank you for investing alongside us for the long term.


Small Caps vs Large Caps – Don’t be penny wise but pound foolish

The good times kept on rolling for share markets in March, with a sea of green across the world as recession fears in the U.S. continued to fade.

Global equities rose +3.3% (MSCI World (USD)). But this was bested by the UK (+4.8%, FTSE 100), European (+4.4%, Stoxx 50) and Australian (+3.5%, ASX 200) share markets.

U.S. large caps (S&P500) were up strongly (+3.2%), but they were more of a laggard this month, with U.S. small caps (+3.6%) outperforming.

With March largely lacking in company-specific news – as Q4 reporting mostly finished in February – shares took good economic news to be good news for markets.

Leading economic indicators, like Purchasing Manager Indices, inflected higher. There was also continued robust labour market numbers in the U.S. Both suggest a recession is not on the doorstep there.

The number of expected interest rate cuts in the U.S. this year continue to be dialled back. Markets are now forecasting less than two 0.25% cuts at writing – well below the six being forecast at the start of Jan). Bond yields are rising and the share market rally since the recent October market lows has started to broaden out from large caps to smalls and mids.

So are we finally witnessing the start of a long-awaited small-cap revival?

In this month’s Letter to Investors, we examine three key issues:

  • What could the catalyst be for a period of sustained small-cap outperformance?
  • The worst-case scenario of a U.S. recession. (The good news is that this scenario is largely priced into small caps versus large caps, which will limit small-cap relative downside if the U.S. economy turns south.)
  • The extreme valuation difference between U.S. small versus large caps and how history is suggesting great relative returns ahead for smaller companies.

When you put all three together, it becomes clear that small-cap stocks are a very attractive proposition relative to large caps, which is giving investors a rare window of opportunity now to buy into small caps.


March 2024 Ophir Fund Performance

Before we jump into the letter in more detail, we have included below a summary of the performance of the Ophir Funds during March. Please click on the factsheets if you would like a more detailed summary of the performance of the relevant fund.

The Ophir Opportunities Fund returned +8.7% net of fees in March, outperforming its benchmark which returned +4.8%, and has delivered investors +21.9% p.a. post fees since inception (August 2012).

🡣 Ophir Opportunities Fund Factsheet

The Ophir High Conviction Fund (ASX:OPH) investment portfolio returned +6.2% net of fees in March, outperforming its benchmark which returned +4.1%, and has delivered investors +13.5% p.a. post fees since inception (August 2015). ASX:OPH provided a total return of +13.0% for the month.

🡣 Ophir High Conviction Fund Factsheet

The Ophir Global Opportunities returned +2.5% net of fees in March, underperforming its benchmark which returned +3.8%, and has delivered investors +14.8% p.a. post fees since inception (October 2018).

🡣 Ophir Global Opportunities Fund Factsheet


What worked … keeps working

It’s hard to get away from the fact though that what ‘worked’ in 2023, has kept on working so far in 2024.

Below we show this for the U.S., the world’s largest share market (by a country mile!).


Larger & growthier continued to outpace smaller & value in 1Q24

Source: Piper Sandler

We break down U.S. share market returns into large, mid and small caps, vertically; and Value, Core and Growth style companies, horizontally.

2023 was all about large cap growth style companies leading the way, particularly the mega cap tech ‘Magnificent 7. Meanwhile, small caps and value were definitely laggards.

2024 has started largely the same, though with some more breadth, particularly winners coming from the mid cap growth cohort of businesses.

Interestingly, all large and mid-cap styles hit new all-time highs (ATH) during the March quarter, while small caps remain significantly off their highs.

As a small-cap manager, this continues to be painful for us in a relative sense. But as regular readers will know, small caps are now extremely attractive relative to large and mid cap companies.


What could be the catalyst for small cap outperformance?

The most common question we get from investors who understand why we are so bullish on the outlook for small caps globally versus large caps is: “What is the catalyst for smalls caps to start outperforming?”

Relative valuations at multi-decade lows for small caps (which we address again later in this letter) is one big reason to be bullish over the next 5-10 years.

But cheap relative valuation is not a catalyst.

The standout and most simple catalyst we believe is simply lower interest rates. And, more specifically, ‘soft landing’ rate cuts.

December last year was a great case in point. It was the only sustained period of significant market breadth and small-cap outperformance since the beginning of this most recent share market rally in October.

We show this in the chart below which maps the relative performance of U.S. small caps (Russell 2000) to large caps (S&P500).


December 2023 showed market breadth and smalls outperformed on “peak rates/cuts ahead” talk from the Fed


Source: Bloomberg

So what happened in December?

It was when the U.S. Fed said for the first time this hiking cycle that they are likely done increasing rates, and when they predicted in their ‘dot plot’ that meaningful rate cuts where likely in 2024.

The starters gun for rate hikes that was shot back in late 2021 had seemingly been holstered.

The closer we get to the expectation of soft-landing rate cuts becoming a reality (currently forecast by the market in Q3 this year), the closer we may be to small caps having a key catalyst for outperformance.

The natural question then becomes: what if we don’t have a soft landing and US recession fears, which have been lingering for the last 12-18 months, finally becomes a reality?


Small caps’ already big underperformance suggests limited relative downside in a recession

It’s an excellent question because around a recession, small caps typically fall first and further than large caps … but then recover the quickest.

We show this in the gold bars below where, outside of the Eurozone, share markets across all the major regions, including Australia, all highlight biggest peak to trough share market falls in small caps compared to large caps around U.S. recessions.

(The reason small caps don’t underperform in the Eurozone is largely a data limitation. Small-cap data for the Eurozone is only available for the last three U.S. recessions (2001, 2008 and 2020). And one of those – the 2001 dot com related recession – was unusual, with large caps falling more than smalls due to the nature of the related tech bubble – heavily influencing the Eurozone result.)

In the black bars, what we have also shown is the maximum peak-to-trough underperformance around U.S. recessions across all the regions. This has varied from as low as -6% in Japan, to as high as -20% in Australia – both during the 2020 COVID-induced recession.

What is most striking is that, as the grey bars show, outside of Australia, in every major region small caps have already underperformed more than in any previous recession[1]. (And in the case of Australia the current -17.5% underperformance is just shy of its historical maximum of -20%.)


The key point here is that, if a recession was to occur in the U.S. this cycle, small caps across the world have generally already underperformed large caps by more than they have historically in any recession. So this may limit the size of any underperformance (or they may even outperform!) … should a recession happen.


Smalls already underperforming Large Caps by more than historical maximum around recession (except Aust but its close!)

Source: JP Morgan, Bloomberg. Data to 31 March 2024.

[1] Using small cap data where available for the last six U.S. recessions back to 1980.

Source: JP Morgan, Bloomberg. Data to 31 March 2024.


What typically happens on the other side of a recession in small versus large caps?

Outperformance!

Below we show the historical average outperformance in small versus large caps in the 1 (gold bar), 2 (black bar) and 3 years (grey bar) after the recession-linked low in the major share market regions.


Average Small vs Large Cap outperformance in years since recession linked equity market trough (100% Hit Rate in Year 1)

Source: JP Morgan, Bloomberg.

What you can see is that across the board in every major region, including Australia, small caps on average have outperformed large caps in the first year.


Not only that but the hit rate is 100%. That means that, not only is there small-cap outperformance on average, but this outperformance has occurred in the first year on every occasion in every region!


The other point is that all, or at least the vast majority, of that outperformance is delivered in the first year. A more granular analysis shows that much of it occurs in the first 3-6 months. So don’t bother trying to time it because it happens so quick you will probably miss it.

The key takeaway for us (Andrew and Steven) is that there is an asymmetry in the payoff of smalls versus large caps globally even if a recession occurs for two reasons:

  • The downside versus large caps may be more limited given the already extreme underperformance for small caps, and
  • The outperformance on the rebound of small caps has been historically consistent, quite significant and front loaded.

That’s why we say, when it comes to small versus large caps globally: don’t be penny wise and pound foolish.

That is, if you ‘pinch pennies’ to avoid the downside (if any given the underperformance already) of small v large caps if a recession occurs, you risk missing the likely big upside (the ‘pounds’) in outperformance of small caps on the other side of any recession.

Given this attractive payoff, both of us have been consistently allocating personal funds into our open global small/mid cap fund since about mid last year.


How much better could smalls caps be than large caps over the years ahead?

As regular readers will know, over the last few months we have highlighted just how extreme the valuation differences are in small cap land compared to large caps (and also even to mid caps).

While valuations are rubbish at predicting returns over the next week, month or year, at the market level they are generally very good over periods like 5-10 years.

Below we show the differences in relative valuations (using the Cyclically Adjusted Price-Earnings ‘CAPE’ Ratio) between US small (Russell 2000) and large caps (S&P500) and their subsequent 10-year relative returns.


Russell 2000/S&P500: Valuations and Returns (10 years)


Source: Bloomberg.

It is crystal clear that the cheaper U.S. small caps are to large caps (a lower starting relative CAPE ratio), the more small caps tend to outperform large caps over the next 10 years.

The relationship is so good that these starting valuations explain almost 2/3s (64%) of the subsequent return difference.

Today the Russell 2000 CAPE ratio is 19x versus 32x for the S&P500 or a relative valuation of 0.6. That’s about the lowest/cheapest since 2000.

Historically, when U.S. small caps have been this cheap versus large caps, they have gone on to outperform them by around 5% p.a. over the next decade.

This is a big deal.

A 5% return on a $100,000 investment, for example, would give you a $63,000 gain over a decade. But a 10% return would give you a $159,000 gain – more than twice the gain due to the benefits of compounding.

For investors that have never considered allocating to small caps, and who have been riding the recent wave of large-cap outperformance, we hope we have made a compelling case for why we think, like it always does, the cycle will turn and we’ll again have the wind at our back as small cap investors.


As always, thank you for entrusting your capital with us.

Kindest regards,

Andrew Mitchell & Steven Ng

Co-Founders & Senior Portfolio Managers

Ophir Asset Management


This document is issued by Ophir Asset Management Pty Ltd (ABN 88 156 146 717, AFSL 420 082) (Ophir) in relation to the Ophir Opportunities Fund, the Ophir High Conviction Fund and the Ophir Global Opportunities Fund (the Funds). Ophir is the trustee and investment manager for the Ophir Opportunities Fund. The Trust Company (RE Services) Limited ABN 45 003 278 831 AFSL 235150 (Perpetual) is the responsible entity of, and Ophir is the investment manager for, the Ophir Global Opportunities Fund and the Ophir High Conviction Fund. Ophir is authorised to provide financial services to wholesale clients only (as defined under s761G or s761GA of the Corporations Act 2001 (Cth)). This information is intended only for wholesale clients and must not be forwarded or otherwise made available to anyone who is not a wholesale client. Only investors who are wholesale clients may invest in the Ophir Opportunities Fund. The information provided in this document is general information only and does not constitute investment or other advice. The information is not intended to provide financial product advice to any person. No aspect of this information takes into account the objectives, financial situation or needs of any person. Before making an investment decision, you should read the offer document and (if appropriate) seek professional advice to determine whether the investment is suitable for you. The content of this document does not constitute an offer or solicitation to subscribe for units in the Funds. Ophir makes no representations or warranties, express or implied, as to the accuracy or completeness of the information it provides, or that it should be relied upon and to the maximum extent permitted by law, neither Ophir nor its directors, employees or agents accept any liability for any inaccurate, incomplete or omitted information of any kind or any losses caused by using this information. This information is current as at the date specified and is subject to change. An investment may achieve a lower than expected return and investors risk losing some or all of their principal investment.  Ophir does not guarantee repayment of capital or any particular rate of return from the Funds. Past performance is no indication of future performance. Any investment decision in connection with the Funds should only be made based on the information contained in the relevant Information Memorandum or Product Disclosure Statement.

Next

15 May, 2024 Letter To Investors - April