NextDC – where Nvidia’s chips live
September.
For some it’s their favourite song – a funky and joyful classic by Earth Wind and Fire, released back in 1978.
“Do you remember
The 21st night of September?
Love was changin’ the minds of pretenders
…
As we danced in the night, remember
How the stars stole the night away, oh, yea”
But for share market investors, September has historically been the worst-performing month of the year. If you were going to leave your brokerage account alone for a month to “dance in the night”, September was the one to take off.
As we show below, on average over the last quarter century, the global share market (MSCI World Index) has fallen -1.5% in September. No other month comes close to being as bad, with a -0.3% fall the next worst.
September – the worst month of the year (MSCI World Index)

Source: Ophir, Bloomberg.
It’s not been because the market always falls in September, though – only 12 of the last 25 Septembers have lost money.
It’s because September has had some of the biggest stinkers for shares. 2022 (recession worries on higher rates/inflation), 2008 (peak GFC fears) and 2002 (Dot.com bubble bursting) all clocked up falls of around -10% or more.
It came as a welcome relief, though, that this September didn’t fall prey to history, with gains extending for the fifth month in a row.
In fact, to the end of September, the S&P 500 had its strongest first nine months of the calendar year since 1997! (Can I hear Earth Wind and Fire singing?)
During September in total return terms the S&P 500 rose +2.1%, while the Nasdaq gained +2.8% and the ASX 200 was up +3.2%.
September 2024 Ophir Fund Performance
Before we jump into the Letter in more detail, we have included below a summary of the performance of the Ophir Funds during September. Please click on the factsheets below if you would like a more detailed summary of the performance of the relevant fund.
The Ophir Opportunities Fund returned +4.6% net of fees in September, underperforming its benchmark which returned +5.1%, and has delivered investors +22.5% p.a. post fees since inception (August 2012).
🡣 Ophir Opportunities Fund Factsheet
The Ophir High Conviction Fund (ASX:OPH) investment portfolio returned +2.6% net of fees in September, underperforming its benchmark which returned +4.1%, and has delivered investors +13.2% p.a. post fees since inception (August 2015). ASX:OPH provided a total return of +2.3% for the month.
🡣 Ophir High Conviction Fund Factsheet
The Ophir Global Opportunities returned +0.8% net of fees in September, outperforming its benchmark which returned -0.1%, and has delivered investors +15.5% p.a. post fees since inception (October 2018).
🡣 Ophir Global Opportunities Fund Factsheet
The Ophir Global High Conviction Fund returned +0.1% net of fees in September, outperforming its benchmark which returned -0.1%, and has delivered investors +10.1% p.a. post fees since inception (September 2020).
🡣 Ophir Global High Conviction Fund Factsheet
Un-inversion concern
September’s share market gains occurred despite the yield curve in the United States ‘un-inverting’ during the month. Historically, that’s been an ominous sign for the US economy and corporate earnings.
The un-inversion happened as the Fed kicked off its interest-rate-cutting cycle with an outsized 0.5% cut in its short-term interest rate, the Fed Funds Rate.
As we show in the bottom panel of the chart below, the yield curve ‘inverts’ – that is short-term interest rates (in this case two-year Treasury yields) rise above long-term interest rates (in this case 10-year Treasury yields) – with the purple line going negative when the Federal Reserve is raising short term rates to cool the economy and lower inflation. This is what happened in 2022.
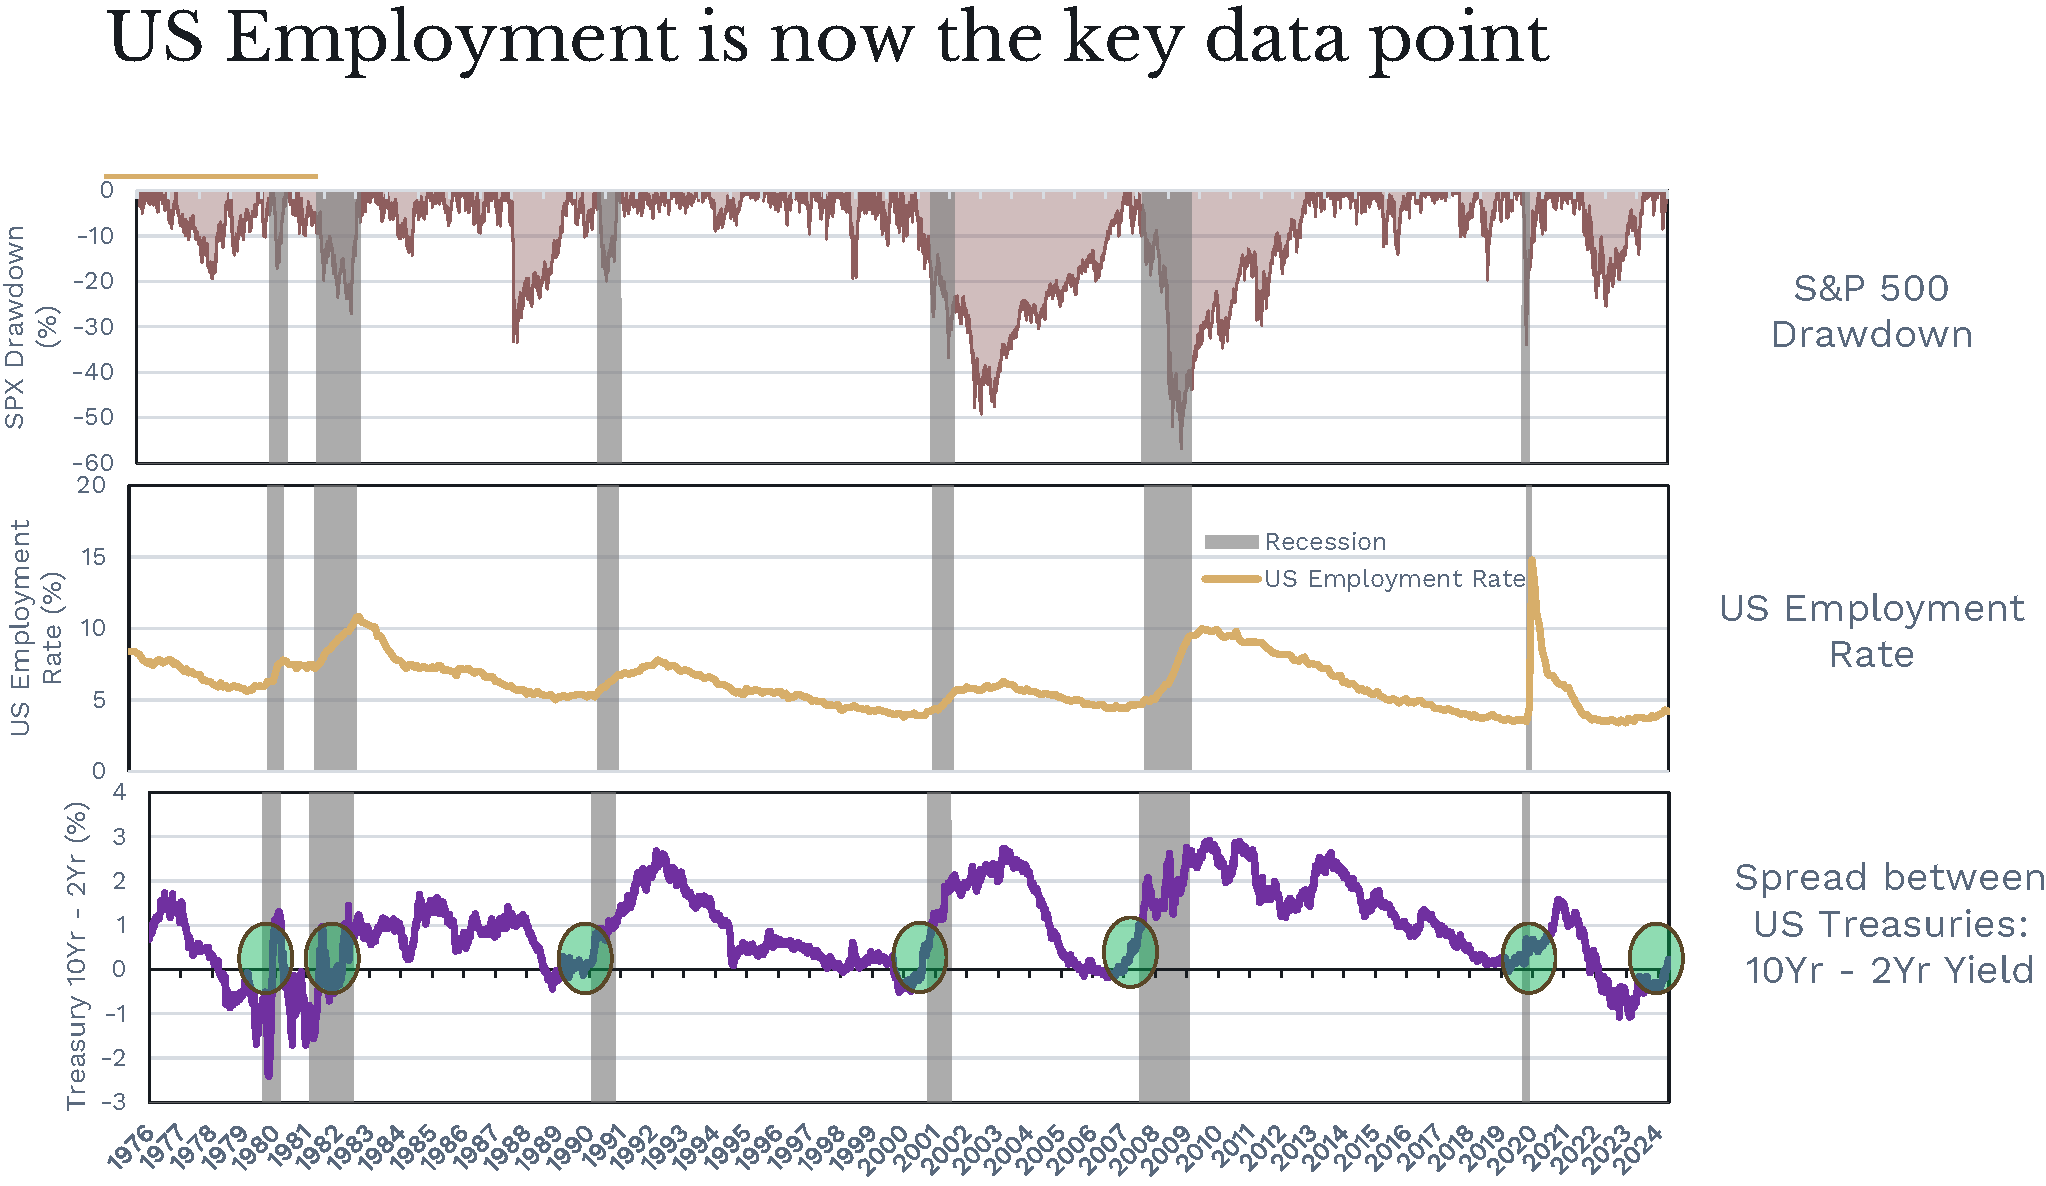
Source: Ophir, Bloomberg.
Historically, when the yield curve un-inverts (green circles) it’s because the market expects the Federal Reserve to cut interest rates as the inflation fight is done – the market now starts worrying about the other side of the Fed’s mandate: maintaining full employment.
That is where we are today, as witnessed by the Fed’s 0.5% cut in September.
Naturally, some are worried that when the un-inversion happens, as seen in the middle chart above, that historically it has meant the Fed is too late and the labour market softens too much. The unemployment rate goes up (yellow line rises) and a recession (grey bars) and its attendant economic and earnings contraction ensues.
During the recession, the fall in corporate earnings typically sees the share market fall, as shown in the top chart by the drawdown (peak to trough fall) in the S&P500 index. Sometimes these falls are more mild (less than 20%), and sometimes they are very severe (greater than 30%).
Is history repeating?
But, pleasingly, the latest data in the US shows the labour market, while cooling, is holding up ok, at least for now. That’s reduced the probability of a recession in the US. In fact, the US unemployment rate, at writing, has just dropped back to 4.1% from 4.3% a couple of months ago.
What, despite higher interest rates, is providing support and helping avoid mass layoffs?
The US economy so far is being kept afloat by several things: continued jobs growth in non-cyclical areas like healthcare, education and the government sector; solid (though not spectacular) company revenues and household income growth; big government spending; and not-too-tight-for-not-too-long monetary policy.
But all eyes, including ours, will remain on the employment picture to see if the softening seen over the last year or so morphs into something more sinister.
China rockets
The other big news in September was the People’s Bank of China (PBoC) finally coming to the party with some meaningful stimulus. Calls have been loud for some time for big stimulus with China mired in slowing growth, a property sector overhang, rock bottom consumer confidence and deflation.
In the last week of September, the PBoC announced a stimulus program that included an interest rate cut, a reserve requirement ratio cut for banks, lowered mortgage downpayments, and support programs for the property and share market.
The Chinese share market loved it!
The MSCI China Index was up over 21% (!) over the last five trading days of September and the rally continued into early October*. Commodities that China voraciously consumes also rocketed on the news, as seen in the chart below of exchange traded funds (ETFs) that follow commodity miners.
*Though just at writing in the second week of October the Chinese share market has given back some of its September gains as the announcement of government fiscal stimulus has come up short of expectations.
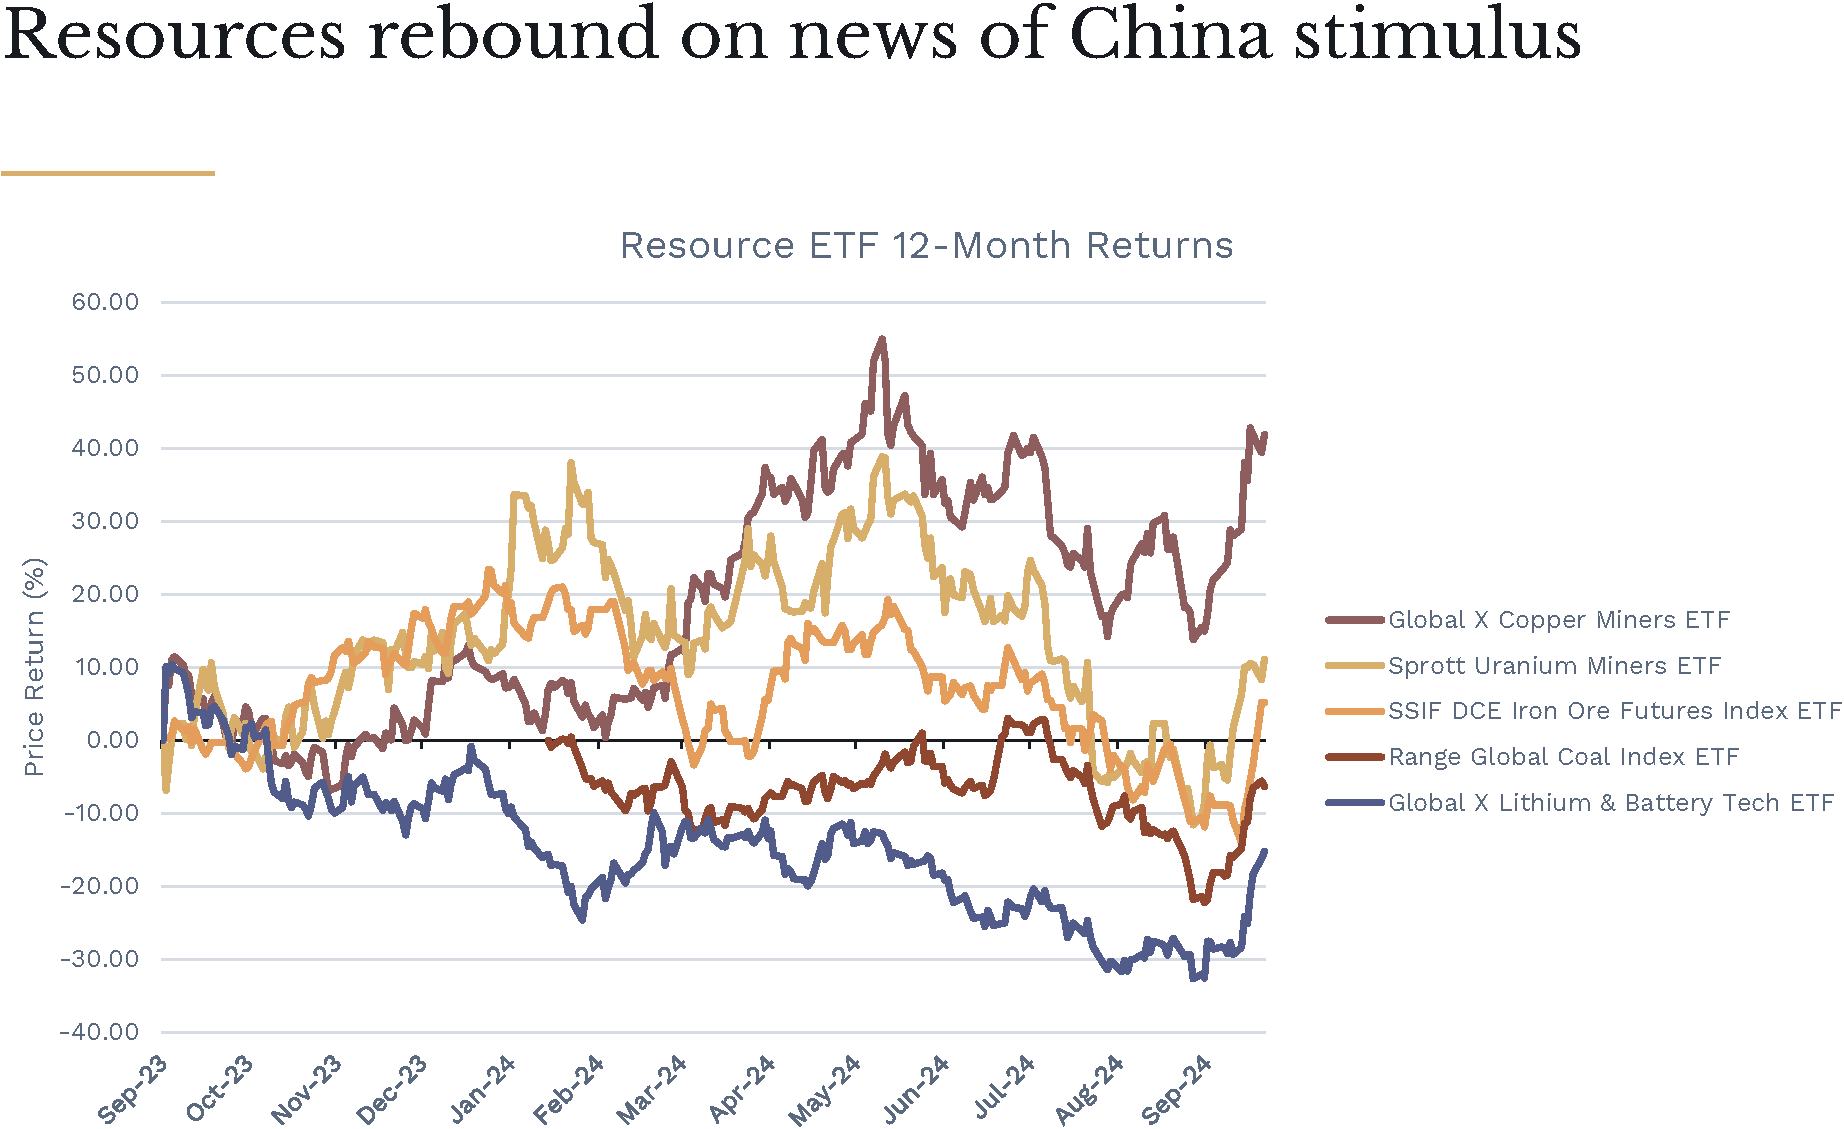
Source: Ophir. Bloomberg.
In response, the ASX 200 Materials index in Australia rose over 12% in those same last five trading days of September.
In a relative sense this created a performance headwind for the Ophir portfolios versus their benchmarks, given we are structurally underweight the Materials sector.
(As a reminder, we prefer more industrial-type businesses that can structurally grow into big-end markets over time, rather than businesses who earnings tend to be more cyclical because of short term swings in – to us at least – largely unforecastable movements in commodity prices).
This was more of a headwind for our Australian Funds where the Materials sector makes up a greater proportion of our benchmark than our Global Funds.
The influence of Materials alone took our Ophir Opportunities Fund from outperforming its benchmark in the first three weeks of the month to underperforming by the end of the month.
As always, we are happy to wear the swings and roundabouts of relative performance due to short-term moves in commodity prices. If we get the earnings right long term in our typically industrial type businesses, investment performance will look after itself.
NextDC – from Microcap to Midcap – where Nvidia’s chips live
Ever since ChatGPT entered the public domain in November 2022, demand for anything artificial intelligence (AI) related has seen computer chip maker Nvidia skyrocket to become, at one point this year, the most valuable listed company in the world.
Naturally, Australian investors have been looking for an AI play on the ASX.
Enter NextDC, Australia’s leading listed data centre operator.
The company is not some ‘Johnny-come-lately’ here just to capitalise on the AI scene. It was founded by wildly successful Australian serial tech entrepreneur, Bevan Slattery – Australia’s answer to Elon Musk – back in May 2010.
NextDC listed on the ASX not long after in December 2010 when it IPO’d at $1 a share, giving it an $80 million market cap. IPO investors got a nice bump on day one with the stock closing at $1.52 a share! But it was definitely still in microcap territory.
Today it’s the 49th largest stock on the ASX with a market cap of $11.2 billion and scratching on the door of the ASX Large Cap Index.
But wait a sec, what’s a data centre anyway, and doesn’t it all seem very mysterious what goes on inside these big data centre ‘boxes’ you might have seen around Australia? And how and why do they benefit from AI?
You’re about to find out.
What’s in the box?

No this is not like the movie Seven! But today’s modern data centres do resemble big boxes, or even mini-Westfield shopping centres in many ways.
Put simply, a data centre – a term born in the 1980s – is a computer room. In fact, some companies still have on-premises data centres/computer rooms where their IT infrastructure, including servers, are kept.
A data centre is the central, physical hub of an organisation’s digital operations. It’s the secure home with the power and cooling essential to operate the network of computer systems that house a business’s data. It is the beating heart of a business’s day to day operations.
Many businesses these days don’t store their IT infrastructure on premises, but rather use external providers like NextDC in what are called Colocation data centres that reduce redundancy and downtime at cheaper cost. You co-locate your IT infrastructure in NextDC’s ‘boxes’ along with that of other companies.
In this way NextDC is like Westfield, the landlord, and you are the tenant, renting space inside the box for your business’s equipment.
But what’s in the box, exactly?
There are really four main categories of ‘things’ you will find inside a NextDC data centre:
- Computing infrastructure: mainly servers, rackspace, cages, and dedicated private suites (sounds like a fancy airline right)
- Storage: your hard drives and solid-state drives
- Network infrastructure: such as cables, switches, routers, and firewalls
- Ancillary items: backup generators, ventilation and cooling equipment, fire suppression systems, and security and monitoring systems
Who uses the box?
NextDC has over 1,800 customers and they include
- Enterprise customers (like Alibaba or any business that wants to move their IT infrastructure out of the office)
- Telcos (like AT&T or Aussie Broadband), and importantly
- So-called Cloud providers (like Google, Amazon and Microsoft), often called ‘hyperscalers’ because of their fast growth
Cloud providers deliver computing services, such as servers, databases, networking, software, storage and intelligence, via the internet. That allows them to offer faster and more flexible resources, high-performance capacity, as well as scalability.
Basically, any services that don’t require physical proximity to the IT hardware in use can be considered candidates for cloud delivery. Don’t have or want your own IT infrastructure? You can use Amazon Web Services, Microsoft Azure or Google Cloud.
But those cloud providers have IT hardware too … and they need to store it somewhere. NextDC provides the data centres for cloud providers to store their hardware. (They even have names for data centres where only cloud providers are in there – they are imaginatively called Cloud Data Centres.)
Which leads us to NextDC’s marketing tagline: “Where the Cloud lives”. Sorry to crush the dreams of those of you who thought it was all happening in satellites in the sky. At least they can get a private suite for their gear at NextDC!
AI turbocharges demand
But perhaps more appropriately for why AI investors have been attracted to NextDC is that it’s also where Nvidia’s chip live. Those servers and racks and cages are stuffed with silicone chips. And AI tools like Generative AI models such as ChatGPT are some of the most chip hungry software applications out there.
The impact of A.I. on data centre demand is not just about increasing capacity, which is clearly does through increased hardware and data storage needs. A.I. workloads often require special hardware called graphic and tensor processing units (GPU/TPUs) which consume more power and generate more heat than traditional servers. Specialised cooling and power distribution systems have had to be designed, along with new network infrastructure to support the low latency (read speed critical) needs of A.I. applications.
Westfield needs more land
A.I. needs are only adding to existing demand of enterprises moving to the cloud and by some estimates is increasing that demand by four to five fold!
Hyperscalers are therefore battling it out to secure the supply (tenancies) of new data centres. They have the hottest product in town, cloud services, and they need somewhere to sell their goods from.
Australia, so far, is behind the US in terms of AI deployment but it’s running hard to catch up.
This is seeing NextDC increasingly move from providing colocation services for businesses’ private IT infrastructure, to hyperscalers.
Like any good landlord, when your building is full, NextDC is searching for more land.
Today, NextDC operates in all the major Australian cities (sorry Hobart) and also some regional areas too, with New Zealand and parts of southern Asia in the works. Sydney has the most, with four operational and another four in the pipeline or under evaluation.
NextDC Data Center locations
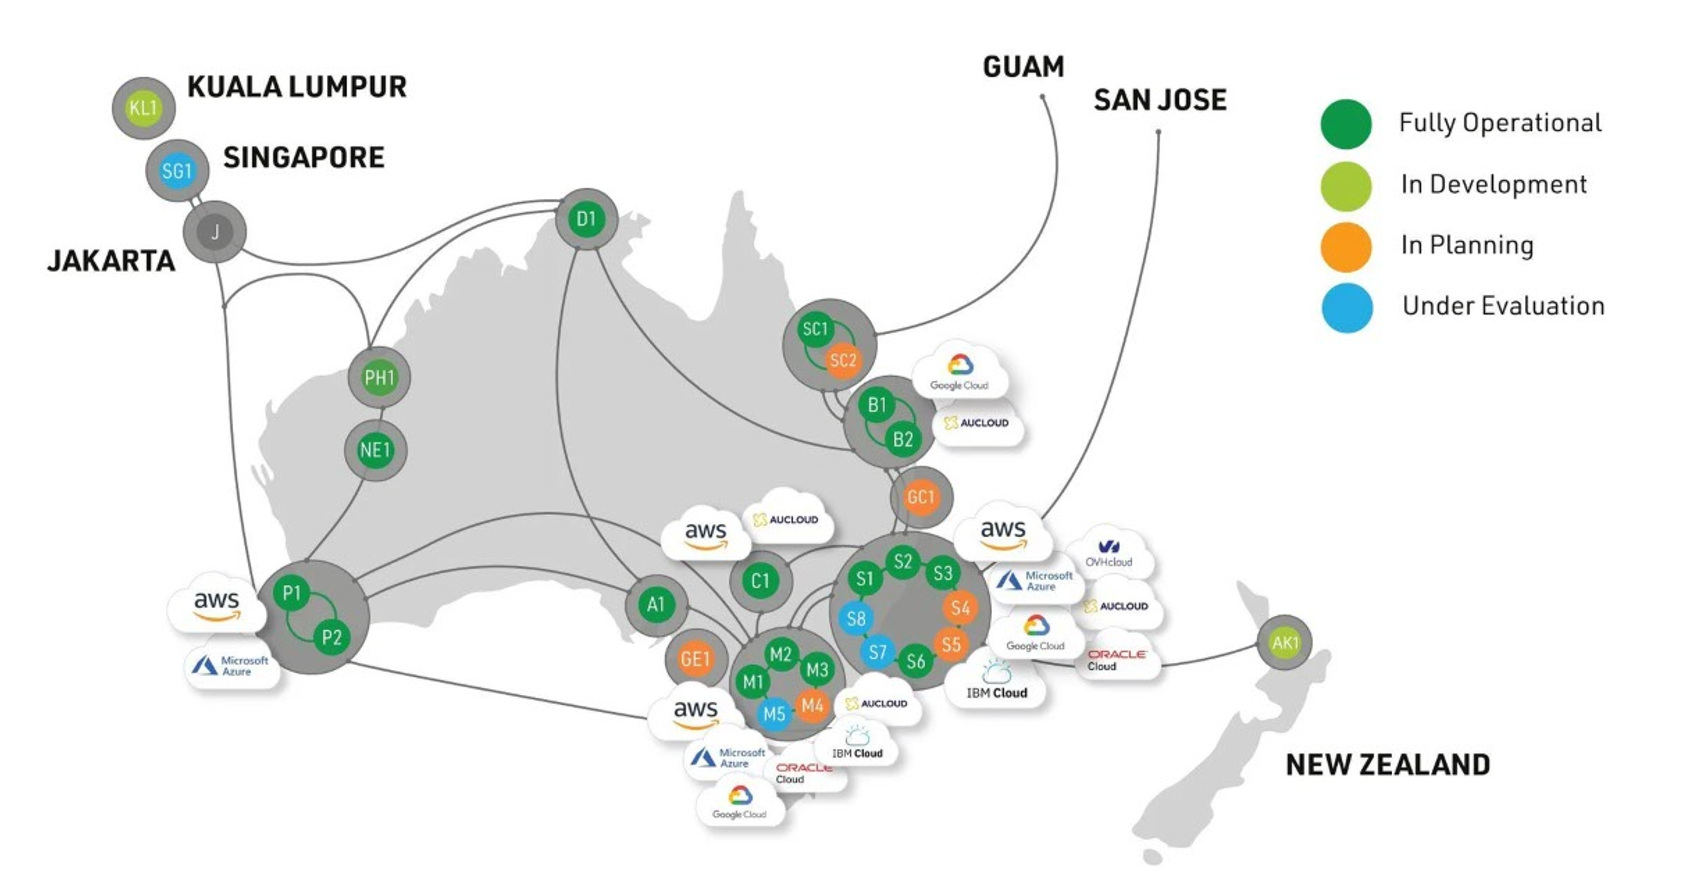
Source: NextDC company website
The next AirTrunk?
Historically it’s taken three years to fill a NextDC data centre with tenants. Today it still takes three years, but the size of the data centres is now roughly three times that of the old ones.
The landscape is also changing.
Many of NextDC’s big competitors aren’t publicly listed, but instead are in private hands. Most public data centre providers have been taken over and taken private. The amount of capital they need to grow is well suited to ownership by big global pension funds that are accumulating inflows.
This represents an opportunity for NextDC.
Deals are happening. Australian competitor, AirTrunk, was recently taken over by a big global pension fund at 20x contracted EBITDA giving an AUD$24 billion valuation.
Takeover or not, the opportunity remains ripe for NextDC. It currently sits in an oligopoly in Australia competing against AirTrunk and CDC (partially owned by New Zealand based and listed company Infratil).
Asia looks to be the next big regional growth leg, with Google eyeing that region and looking for data centre partners.
NextDC is also prioritising so-called Edge Data Centre investments. They’re the next stage in data centre development, where smaller centres are strategically located physically close to the edge of a network, and the populations they serve, to provide low-latency high-performance computing for latency sensitive applications like virtual reality, financial systems, gaming or the Internet-of-things (IoT).
This 14-year-old company might still be in its teenage years, but like most teenagers, it still has a lot of growth ahead.
A big winner for Ophir
We first bought into NextDC in the Ophir Opportunities Fund on the 28th of November 2013 at $2.01 when it was a $415 million market-cap company.
As the company grew, we then bought it in our Ophir High Conviction Fund on the 18th of April 2016 at $2.80 when it was a $700 million market-cap company.
We have held NextDC ever since and it now trades at over $17 with a market capitalisation of around $11.2 billion at writing.

Source: Ophir. Bloomberg.
It has been one of our longest-held positions in our Australian Funds, and we have gotten to know the company very well over our more than decade of ownership.
Of course, like most great growth stories, it’s not been all smooth sailing. The bottom chat shows the drawdowns (peak to trough falls) of its share price since IPO. (20%, 30% and even 40% falls have been seen over the journey and some of them quite regularly.)
Doing the work and staying the course has certainly paid off, though, with the share price rising at a 22.0% per annum clip since we first purchased in 2013.
NextDC is and remains a classic Ophir stock. A fast growing business, growing into a big end market, with long term company and industry tailwinds. And A.I. is only just starting to put a big gust behind that tailwind.
As always, thank you for entrusting your capital with us.
Kindest regards,


Andrew Mitchell & Steven Ng
Co-Founders & Senior Portfolio Managers
Ophir Asset Management
This document is issued by Ophir Asset Management Pty Ltd (ABN 88 156 146 717, AFSL 420 082) (Ophir) in relation to the Ophir Opportunities Fund, the Ophir High Conviction Fund and the Ophir Global Opportunities Fund (the Funds). Ophir is the trustee and investment manager for the Ophir Opportunities Fund. The Trust Company (RE Services) Limited ABN 45 003 278 831 AFSL 235150 (Perpetual) is the responsible entity of, and Ophir is the investment manager for, the Ophir Global Opportunities Fund and the Ophir High Conviction Fund. Ophir is authorised to provide financial services to wholesale clients only (as defined under s761G or s761GA of the Corporations Act 2001 (Cth)). This information is intended only for wholesale clients and must not be forwarded or otherwise made available to anyone who is not a wholesale client. Only investors who are wholesale clients may invest in the Ophir Opportunities Fund. The information provided in this document is general information only and does not constitute investment or other advice. The information is not intended to provide financial product advice to any person. No aspect of this information takes into account the objectives, financial situation or needs of any person. Before making an investment decision, you should read the offer document and (if appropriate) seek professional advice to determine whether the investment is suitable for you. The content of this document does not constitute an offer or solicitation to subscribe for units in the Funds. Ophir makes no representations or warranties, express or implied, as to the accuracy or completeness of the information it provides, or that it should be relied upon and to the maximum extent permitted by law, neither Ophir nor its directors, employees or agents accept any liability for any inaccurate, incomplete or omitted information of any kind or any losses caused by using this information. This information is current as at the date specified and is subject to change. An investment may achieve a lower than expected return and investors risk losing some or all of their principal investment. Ophir does not guarantee repayment of capital or any particular rate of return from the Funds. Past performance is no indication of future performance. Any investment decision in connection with the Funds should only be made based on the information contained in the relevant Information Memorandum or Product Disclosure Statement.